When an earthquake strikes, the intensity of earthquake shaking determines the severity of damage. In turn, the main factors affecting earthquake shaking intensity are earthquake depth, proximity to the fault, the underlying soil, and building characteristics—particularly height. Let’s take a look at the latter two (soil and buildings) and how they interact.
Earthquake Shaking Affected by Soils
One factor with a significant effect on shaking intensity is the type of soil. Soils can also be classified as flexible, rigid, or somewhere in the middle. Flexible soils include clays, fill, and soft sands. Typically, these soils are located closer to water sources- near lakes or on former lake beds; and adjacent to bays, rivers, and historical estuaries. Rigid soils include hard sands or rock, often found in hilly or mountainous areas.
As a comparison, this Magnitude 6.5 earthquake in Nevada caused lower shaking intensity than this Magnitude 5.5 in California, mainly because the M6.5 was centered on hard rock whereas the M5.5 was centered on a soft sandy soil.
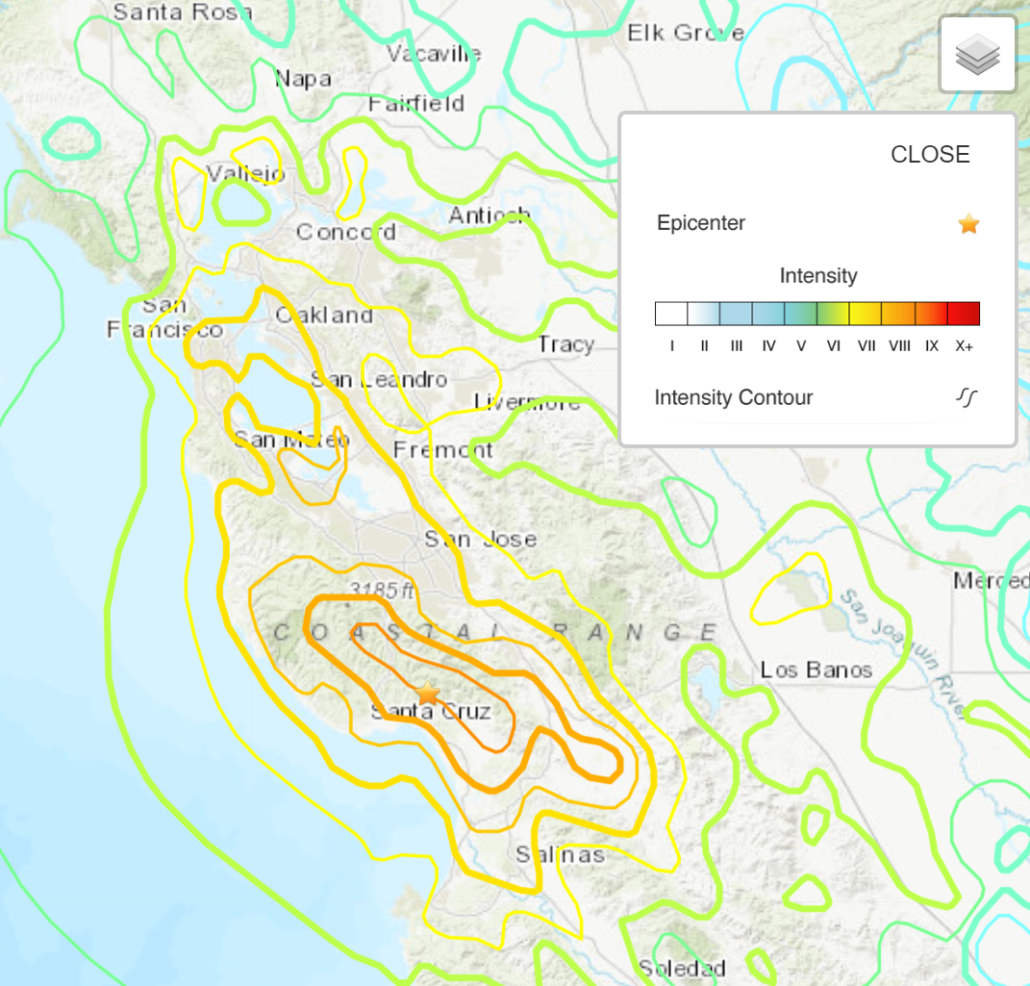
Flexible soils can amplify earthquake forces and damage. For example, during the Loma Prieta earthquake in 1989, some parts of the San Francisco Bay Area experienced damage, though far from the epicenter, because of soft soil amplification. On the Modified Mercalli Intensity (MMI) line map below, the epicenter is shown with a star. While the shaking intensity decreases south of the epicenter, the strong shaking spreads northward partly because of the soft mud and fill around the shore of the San Francisco Bay.

Earthquake Shaking Effect on Buildings
Another factor that significantly affects shaking intensity is the structural configuration of the building being shaken.
Each building absorbs and transmits seismic waves differently, depending on its natural period of vibration. This is similar to how noises sound different when they’re traveling through air or water. The natural period of a structure is an integral characteristic of any given building, like part of its “DNA,” and it’s based on several factors. Each different building structure has its own intrinsic natural period of vibration.
The first factor affecting a building’s natural period is its material type—steel or concrete or wood. The second factor is the spacing and arrangement of columns, walls, bracing, including the amount of reinforcement.
Third but perhaps most significant, the height of the building affects its natural period.
Generally, taller buildings are more flexible and tend to sway, while shorter buildings are more rigid and tend to “quiver” or “pulse.” In the language of physics and structural engineering, the taller, “sway” buildings attract and transmit less (lower) earthquake acceleration, whereas the shorter, “pulse” buildings experience higher earthquake accelerations.
Estimating a Building’s Seismic Response
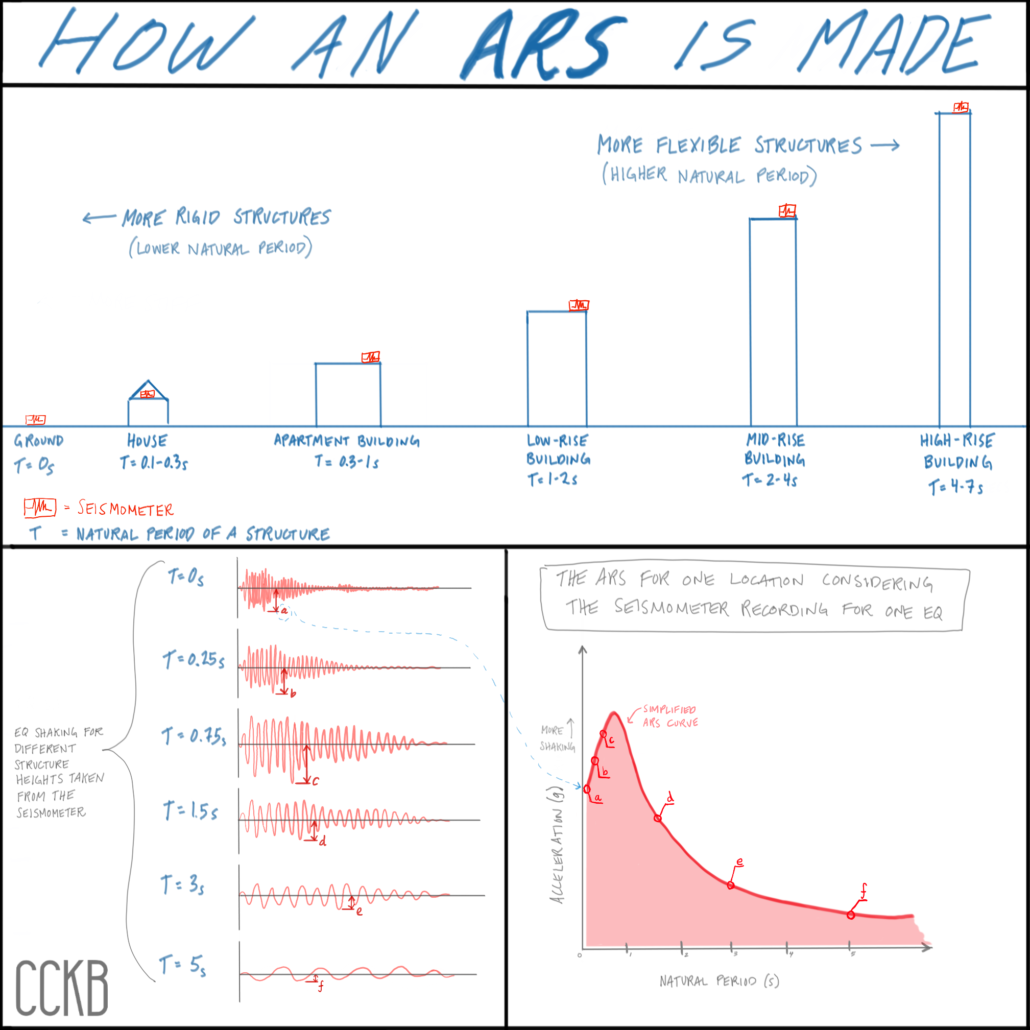
Speaking of accelerations, one tool used by structural engineers to estimate earthquake shaking of a structure is called the Acceleration Response Spectrum (ARS). As shown in the sketch below, an ARS is a graph depicting the maximum amount of shaking experienced in a structure.
Each ARS graph is unique to a specific location. For that location, the Y-axis of an ARS graph shows maximum acceleration and X-axis shows the natural period. A single ARS graph can depict maximum shaking for any variety of structures at that location, because each different building structure has its own intrinsic natural period of vibration.
An ARS graph is created based on past earthquake shaking experienced at that location, measured by a seismometer, or accelerograph.

Soil-Structure Interaction in an Earthquake
An earthquake radiates through the earth from the epicenter. When the seismic waves travel through soil, it changes how the vibrations are felt on the ground. The earthquake vibrations then transfer up through buildings, which again changes how we feel the earthquake if we’re inside the building.
With so many different types of both structures and soils, the interaction between the two results in many possible combinations. Let’s look at the two extremes for soil—soft fill and rock—and the range of structures from houses to high-rise buildings.
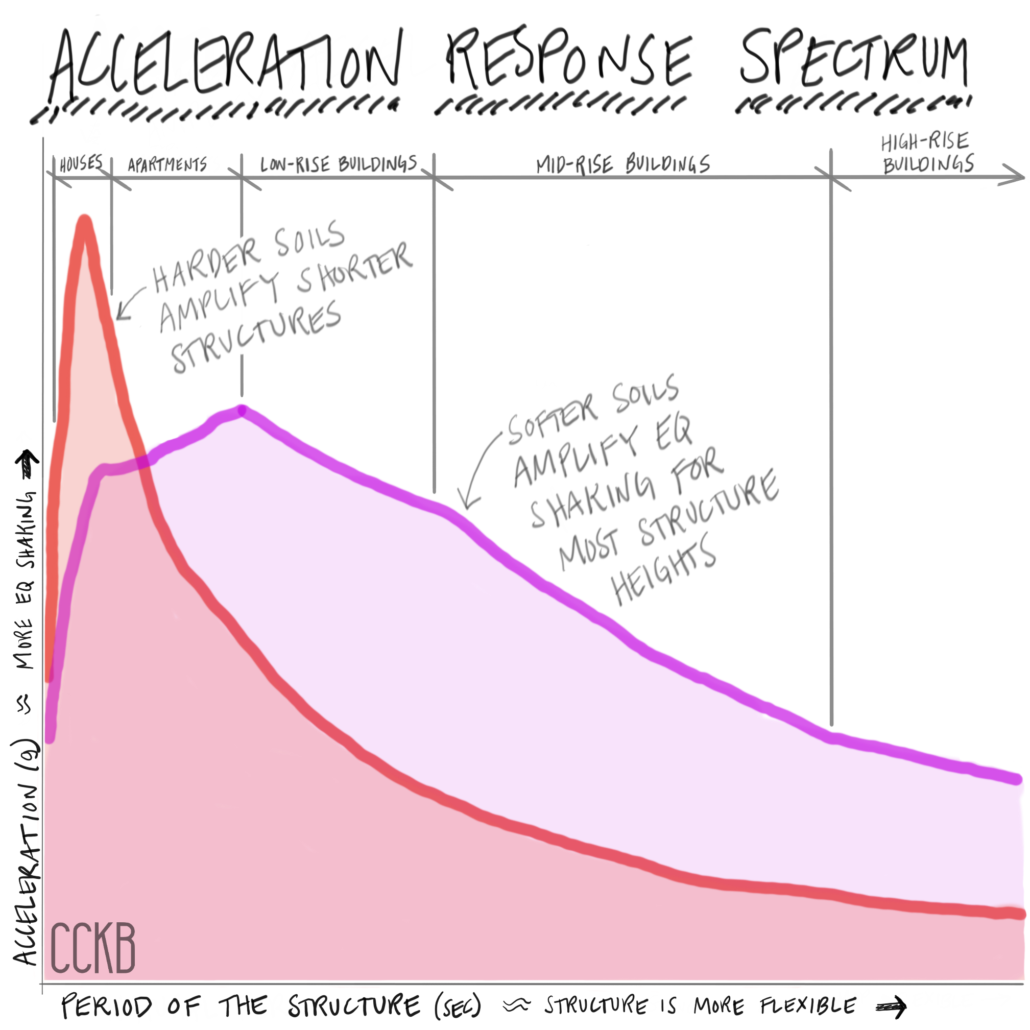
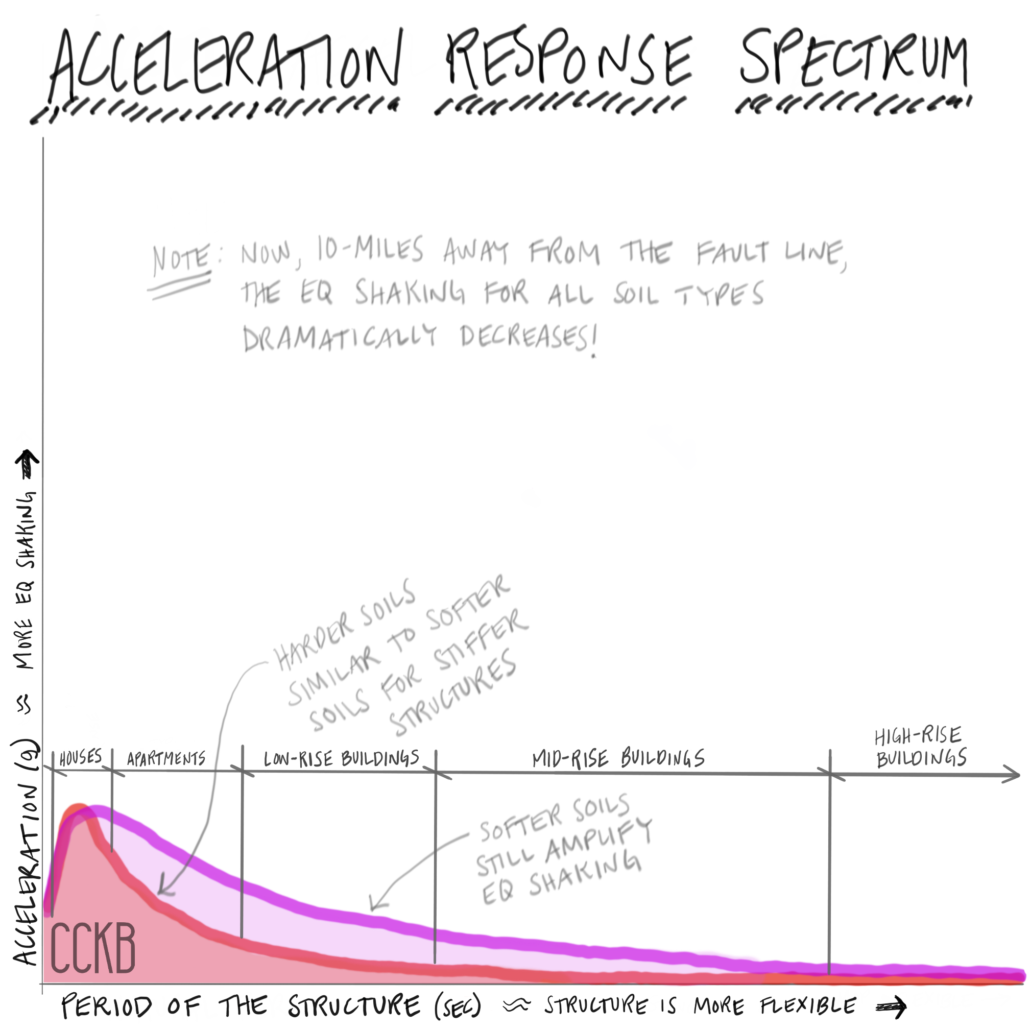
Two example ARS curves are shown below, the first for a location just adjacent to a fault that ruptures, and the second for a location that is 10 kilometers away from a fault rupture. In both graphs, the red line shows the response of structures on rock sites, and the purple line shows the response of structures on soft fill soils.


Recalling that the x-axis represents the building’s natural period, the left side left represents rigid, short buildings. The farther to the right, the taller, and more flexible the building. Various building types are labeled at the top of the graphs.
Both Building Structure and Soils Affect Earthquake Shaking
We can draw three main conclusions from these graphs.
First: shorter, stiffer buildings (those with lower periods) experience more-intense shaking (higher accelerations). This can be seen on both graphs. Regardless of which line color, the farther left on the graph, the higher the acceleration. This trend is true regardless of whether the location is near the fault or away from the fault.
Second, soft soils experience consistently higher shaking intensity than rock sites. Notice that the purple lines are generally higher than (above) the red lines, except for the far-left areas of the graphs, which correspond to the shortest, stiffest structures (like a single-story house). Again, this is the case regardless of whether the location is near the fault or away from the fault.
Finally, accelerations near the fault are roughly four times the shaking experienced 10-miles away from the fault. This can be seen by comparing the magnitudes of acceleration on any given line, between one graph and the other.
Now would you like to figure out how close you are to the fault? You can look it up here, on USGS’s fault map.

